Google Visualization API
Using jQuery to handle AJAX request and JSON response is a breeze. After completing yesterday's demo, I discovered the Google Visualization API. I decided to display a report and feed the report with data requested using AJAX.
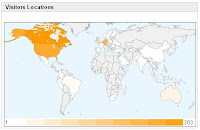
For this demo, I'll display an Intensity Map with Visitors Locations per Country.
You can see a working example of the AJAX display visitors locations w/ Google Visualization API demo.
1) The Intensity Map
Create an HTML Region.
The source is:
<div id="intensitymap_div" class="google-visualization-intensitymap-container" style="width:440px; height:264px;" />
2) JavaScript Code
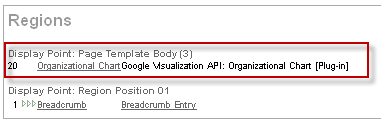
3) APEX Application Process
A more interesting "Web 2.0" demo could display visitors locations in real time using Google Client Location.
For this demo, I'll display an Intensity Map with Visitors Locations per Country.

You can see a working example of the AJAX display visitors locations w/ Google Visualization API demo.
1) The Intensity Map
Create an HTML Region.
The source is:
<div id="intensitymap_div" class="google-visualization-intensitymap-container" style="width:440px; height:264px;" />
2) JavaScript Code
<script src="http://www.google.com/jsapi"></script>
<script>
 // Load jQuery
 google.load("jquery", "1.2.6", {uncompressed:false});

 // Load Google Visualization API
 google.load('visualization', '1', {packages: ['table', 'intensitymap']});
</script>
<script>
 function drawIntensityMap() {
     $.ajax({
         type: "POST",
         url: "wwv_flow.show",
         data: {p_flow_id:$('#pFlowId').attr("value"),
                p_flow_step_id:$('#pFlowStepId').attr("value"),
                p_instance:$('#pInstance').attr("value"),
                p_request:"APPLICATION_PROCESS=GET_VISITORS_PER_COUNTRY"
         },
         dataType: "json",
         success: function(data, textStatus){
             if ((nb_country = data.length) > 0) {
                 var map_data = new google.visualization.DataTable();
                 map_data.addColumn('string', 'Country');
                 map_data.addColumn('number', 'Visitors');
                 map_data.addRows(nb_country);

                 for (i = 0; i < nb_country; i++) {
                     map_data.setCell(i, 0, data[i].country);
                     map_data.setCell(i, 1, Number(data[i].visitors));
                 }

                 var imap = new google.visualization.IntensityMap($x('intensitymap_div'));
                 imap.draw(map_data, {});
             }
         }
     });
 }

 $().ready(function() {
     drawIntensityMap();
 });
</script>
3) APEX Application Process
DECLARE
l_retval    VARCHAR2(32767);
l_rows      VARCHAR2(32767);
BEGIN
FOR i IN (SELECT cc.code
                ,cv.visitors
          FROM   jq_country_visitors cv
                ,jq_iso_3166_country_codes cc
          WHERE  cv.country = cc.country)
LOOP
    l_rows := l_rows||'{''country'':'''||i.code||''',''visitors'':'''||i.visitors||'''},';
END LOOP;

l_retval := '['||rtrim(l_rows,',')||']';

htp.prn(l_retval);
END;
A more interesting "Web 2.0" demo could display visitors locations in real time using Google Client Location.

Comments
I have successfully amended it to display a line chart.