Google Visualization API
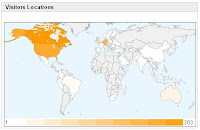
Using jQuery to handle AJAX request and JSON response is a breeze. After completing yesterday's demo, I discovered the Google Visualization API . I decided to display a report and feed the report with data requested using AJAX. For this demo, I'll display an Intensity Map with Visitors Locations per Country. You can see a working example of the AJAX display visitors locations w/ Google Visualization API demo . 1) The Intensity Map Create an HTML Region. The source is: <div id="intensitymap_div" class="google-visualization-intensitymap-container" style="width:440px; height:264px;" /> 2) JavaScript Code <script src="http://www.google.com/jsapi"></script> <script> // Load jQuery google.load("jquery", "1.2.6", {uncompressed:false}); // Load Google Visualization API google.load('visualization', '1', {packages: ['table', 'intensitymap']}); </script> <script...