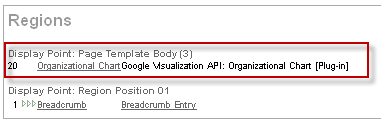
It's possible display the relationship of your company employees using the Google Visualization: Organizational Chart . How it works: I use jQuery AJAX to call an application process called GET_EMPLOYEES_RELATIONSHIP . The response is in JSON. I use jQuery to handle the JSON object. You need to store your chart data inside a "google.visualization.DataTable()" object. I use the same data table to feed the Table Chart and the Org. Chart. I created 2 examples. 1) Single Tree View Your can see a working example of the employees relationship Organizational Chart demo (1). This is how I define a data table cell: for (i = 0; i < emp_count; i++) { l_data_table.setCell(i, 0, data[i].emp_ename); l_data_table.setCell(i, 1, data[i].mgr_ename); } 2) Multiple Trees View Your can see a working example of the employees relationship Organizational Chart demo (2). This is how I define a data table cell: for (i = 0; i < emp_count; i++) { l_data_table.setCell(i, 0, data[i].emp...


Comments
I missed this earlier. This is a strange problem that I don't think should be happening. I made a plug-in to Load CLOB values but it only uses a single Ajax request which makes it limited to the max size post allowed by the listener - usually around 2MB.
I was thinking about working around that limitation by splitting things up into multiple async requests. Sounds like I'm going to hit on this issue and attempt to come up with another solution as I can't depend on queues.
Thanks for the heads up!
Regards,
Dan
I will post about my current solution... :)